
Real-use examples
The tool in action
Real price action analysed with Investiming — the percentiles these moves reached across different assets and market conditions.
Bitcoin
BTC case studies
BTC's drop from the 2025 all-time high
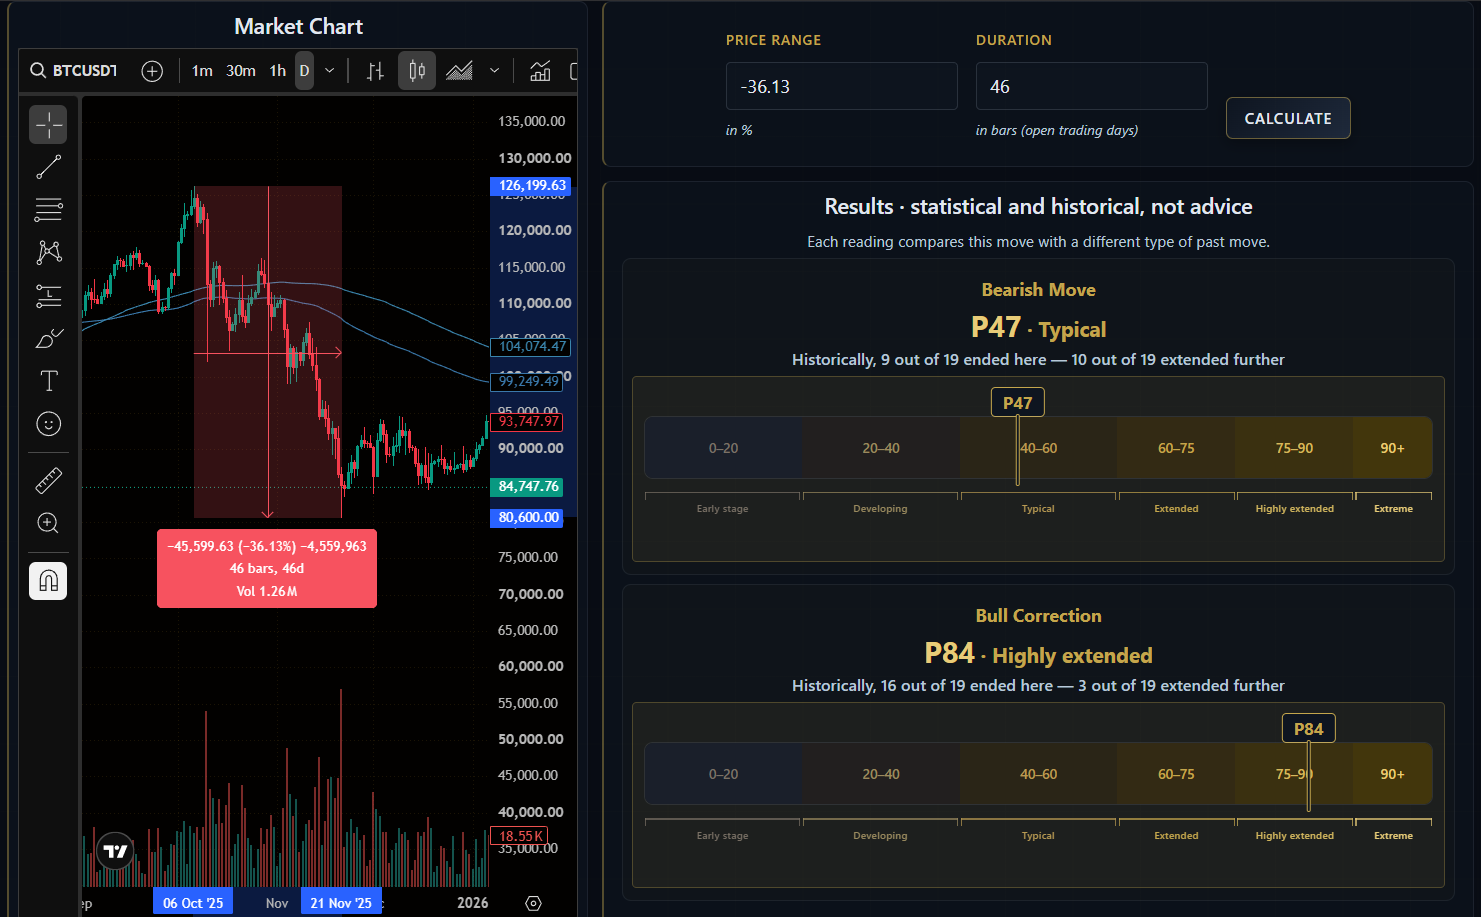
Movement−36.13% / 46 bars
ResultsBearish move: P47 · Typical
ConclusionRead as a bull correction, the same move measures P84 — 16 out of 19 past bull corrections ended here.
Bitcoin price action: April – October 2025
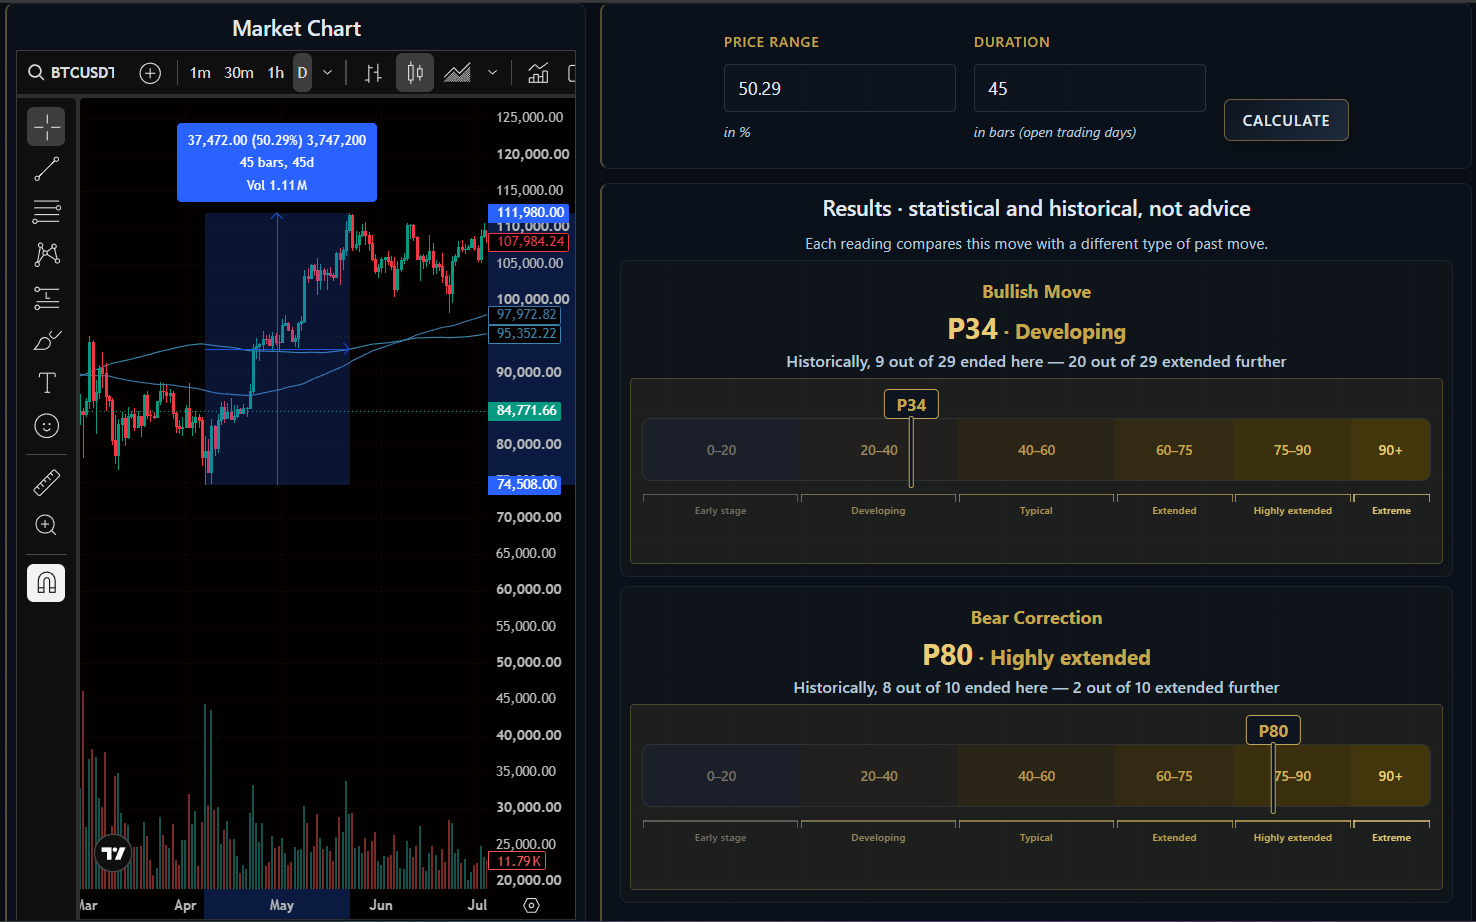
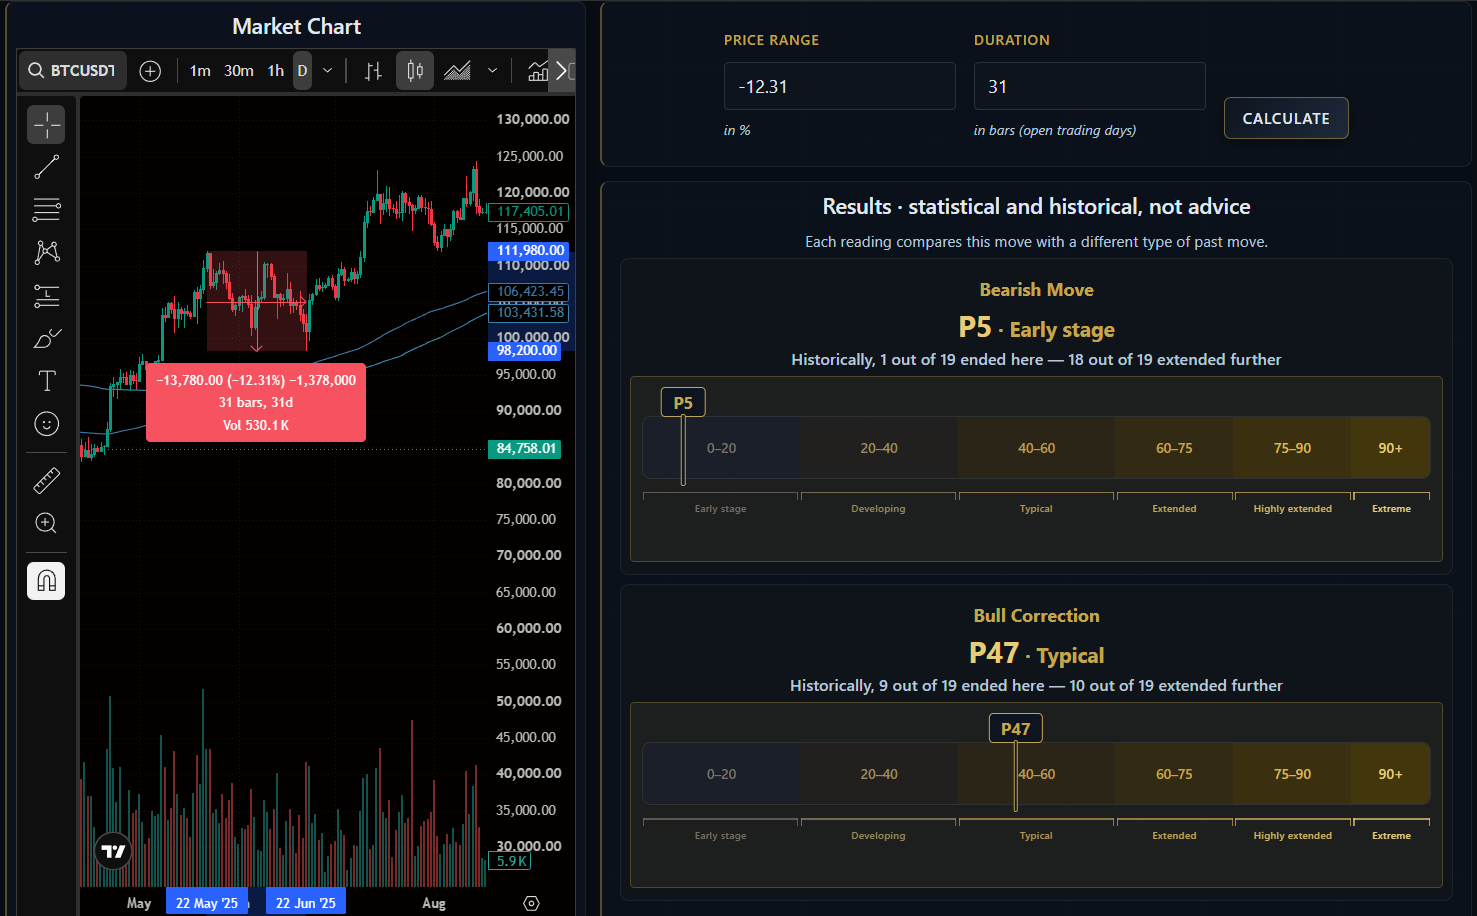
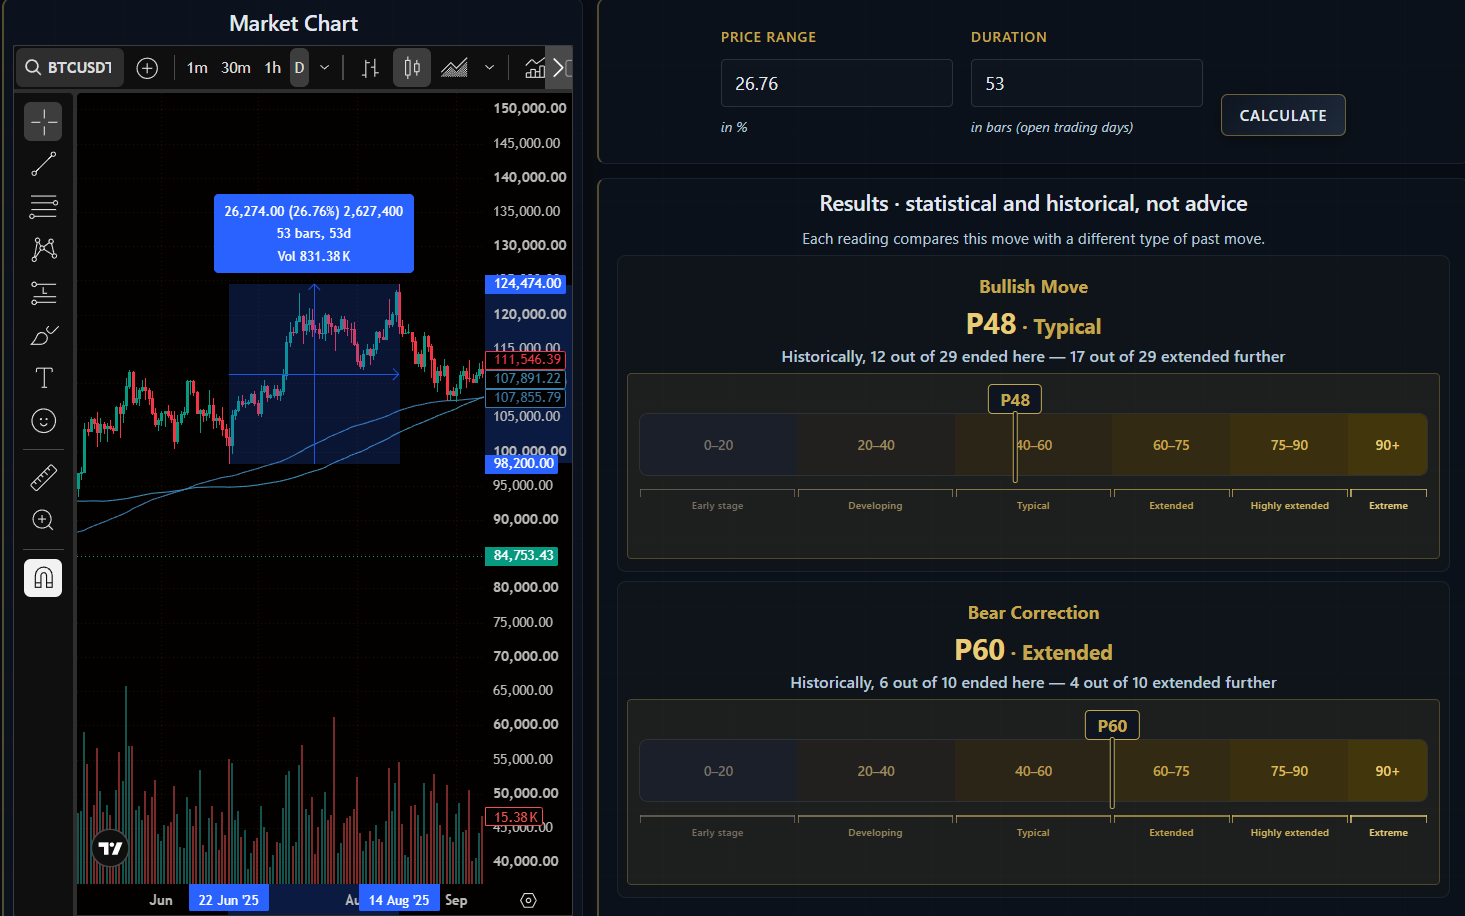
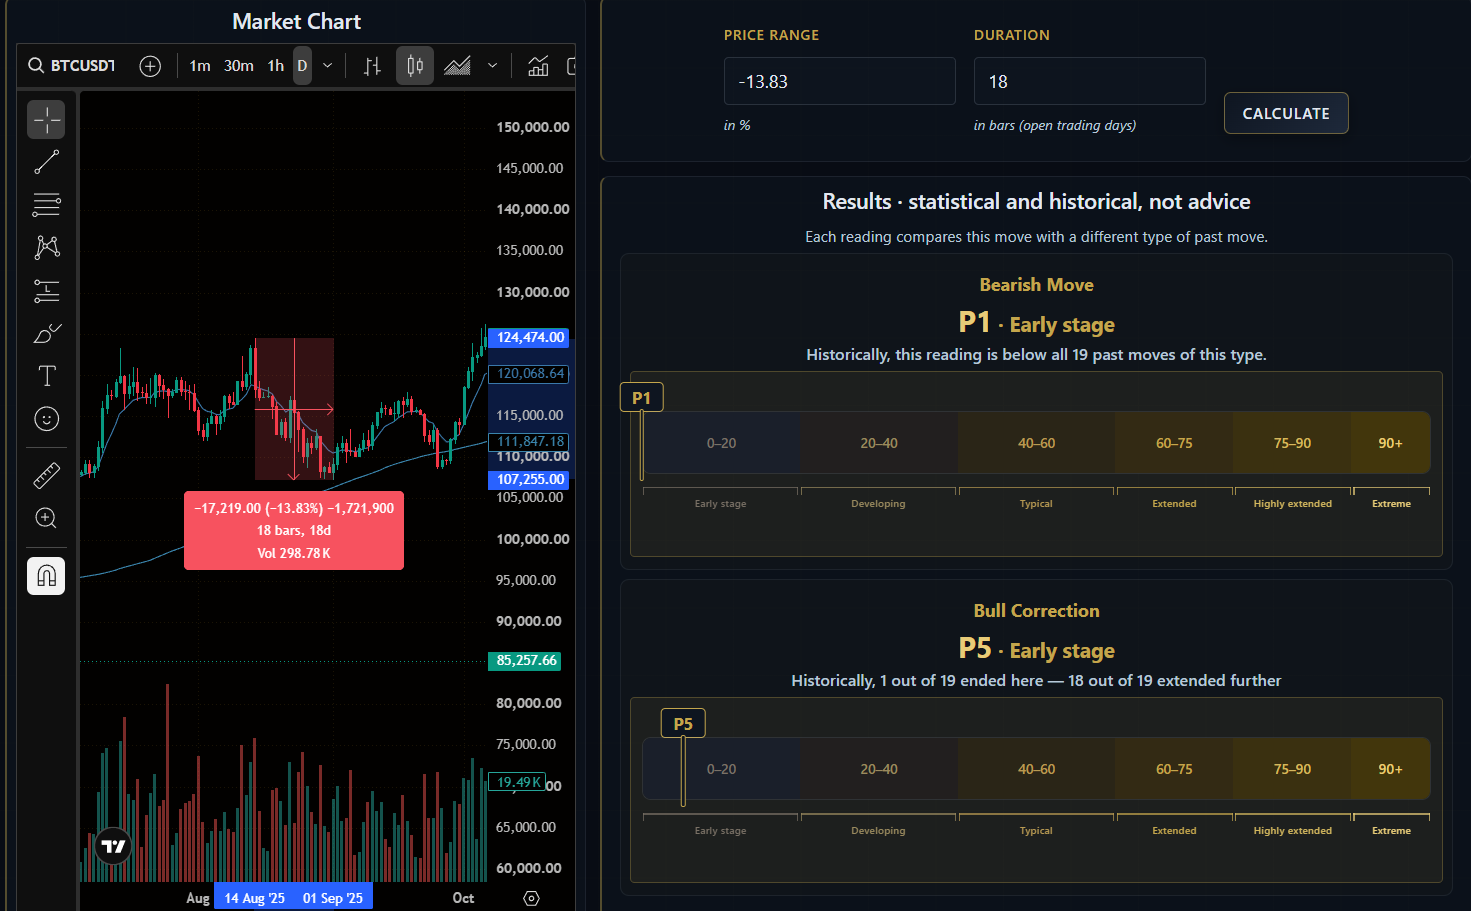
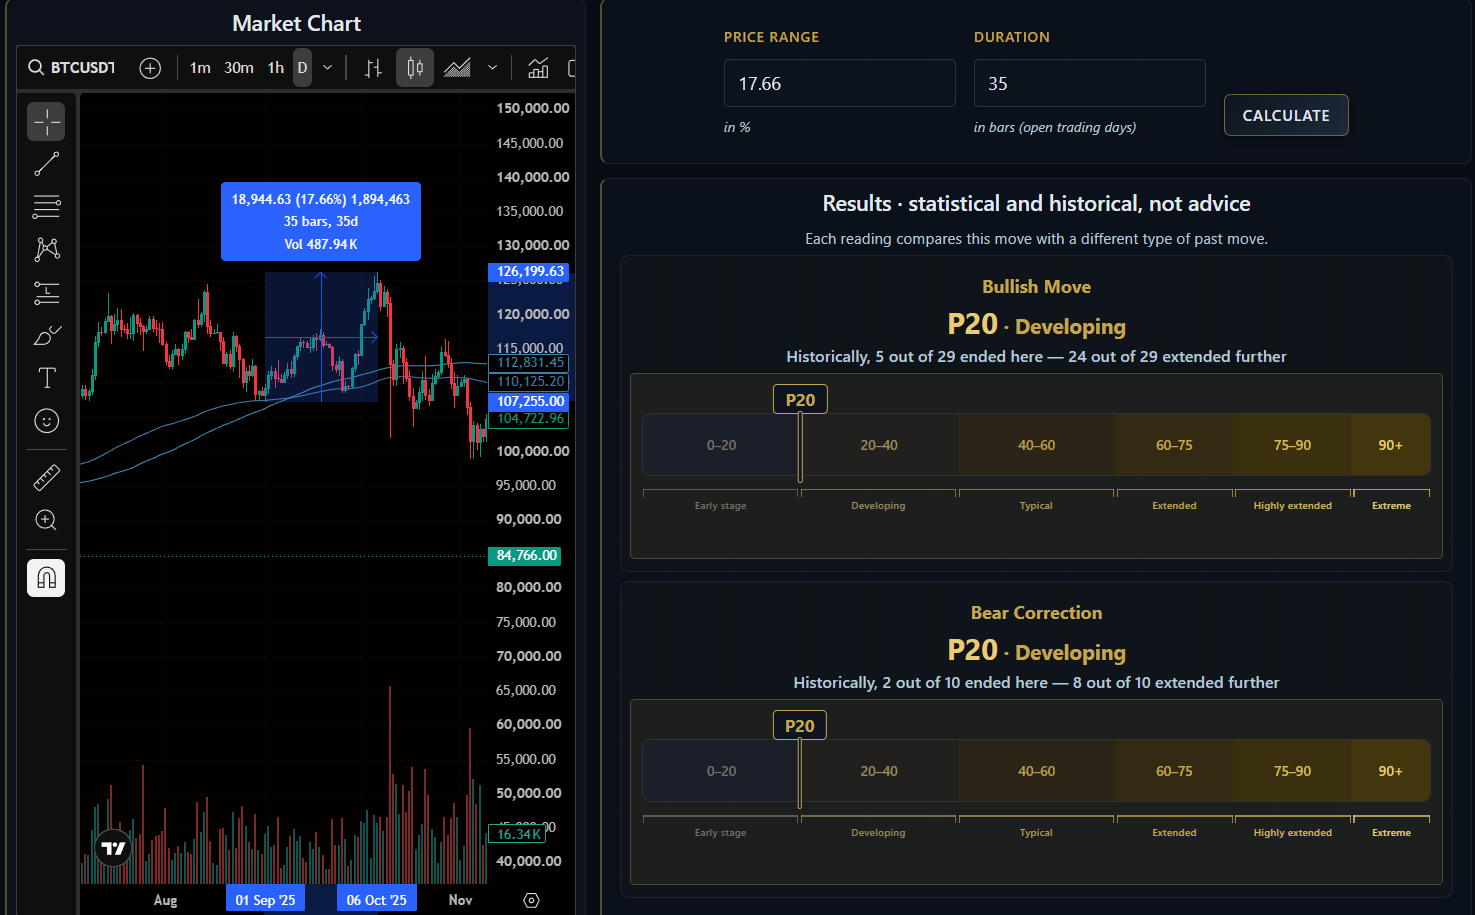
| Phase | Movement | Results |
|---|---|---|
| Bullish move 1 | +50.29% / 45 bars | P34 |
| Bull correction 1 | −12.31% / 31 bars | P47 |
| Bullish move 2 | +26.76% / 53 bars | P48 |
| Bull correction 2 | −13.83% / 18 bars | P5 |
| Bullish move 3 | +17.66% / 35 bars | P20 |
ConclusionThe last impulse (P20) and the last correction (P5) ended at the lowest percentiles of the cycle.
Gold
Gold case studies
Gold's run to all-time high and the following pullback (January 2026)
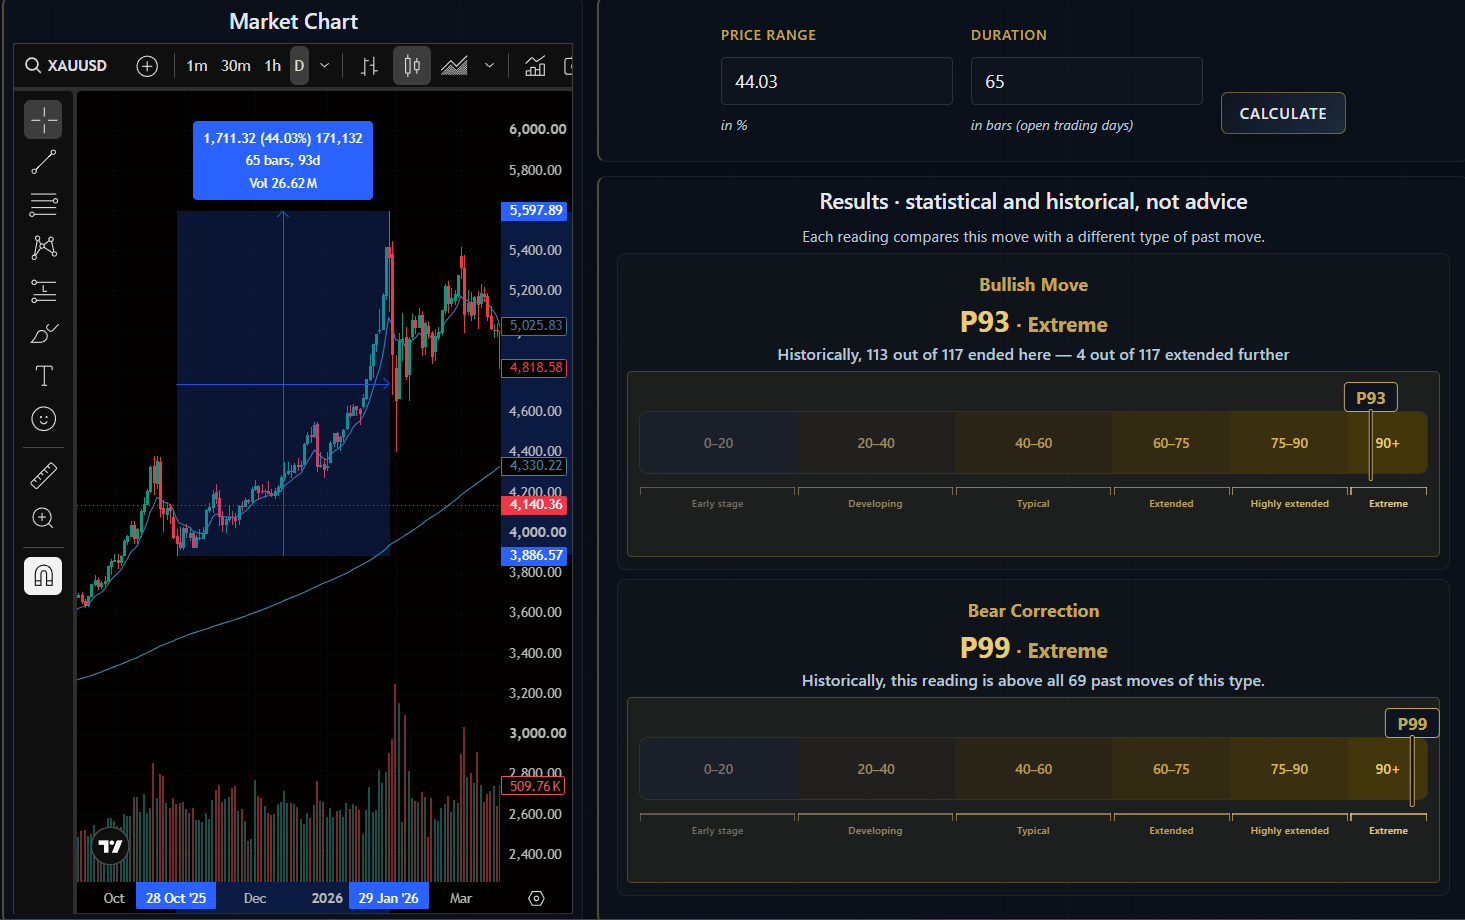
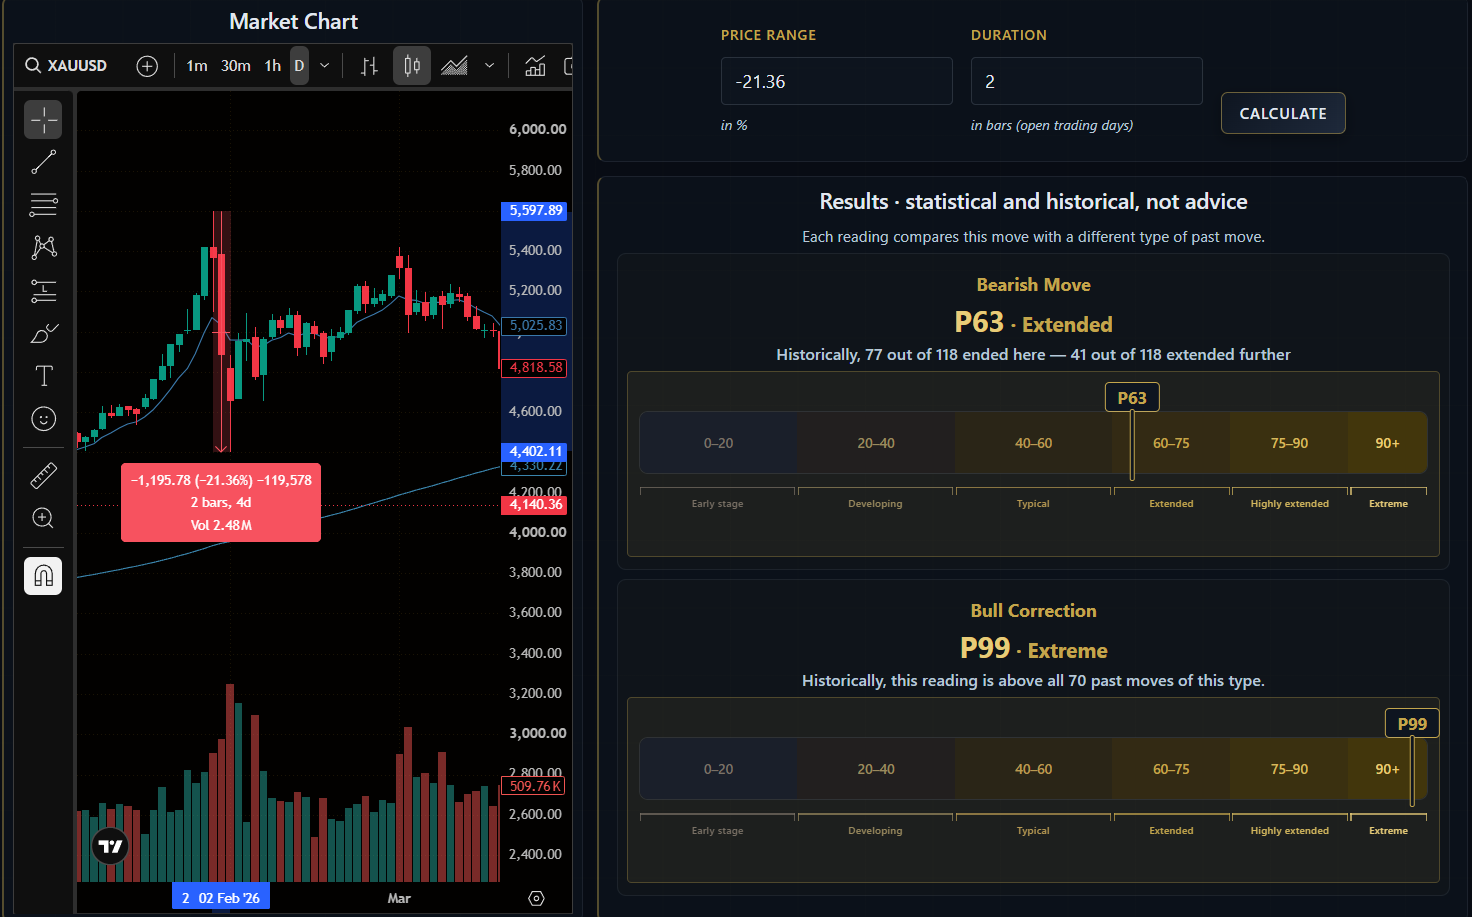
| Phase | Movement | Results |
|---|---|---|
| Bullish move | +44.03% / 65 bars | P93 · Extreme |
| Bull correction | −21.36% / 2 bars | P99 · Extreme |
ConclusionThe bullish move reached P93 over 65 bars; the correction that followed, P99 in 2 bars.
Try it yourself
Run your own percentile for the S&P 500 or Gold — no account required.
Risk disclaimer: The percentiles generated by Investiming are statistical calculations based on historical price data and do not constitute financial advice. Past price patterns do not guarantee future results. Movements may end earlier or extend beyond historical averages. Always apply your own judgement before making any investment or trading decision.


