
How far this move has already run
Investiming measures how far the current move has run against every past move of the same type — and reports the historical extension percentile.
Every move ends somewhere. Investiming shows where the current one sits against the ones that came before.
We’ve all been there...
You’ve been watching an asset move for days. The move already feels extended. You still don’t know how far it has run compared with past moves.
I never know whether I'm early or late.
Investiming places the current move in its historical distribution: the share of past moves of the same type that ended before this point.
A real example
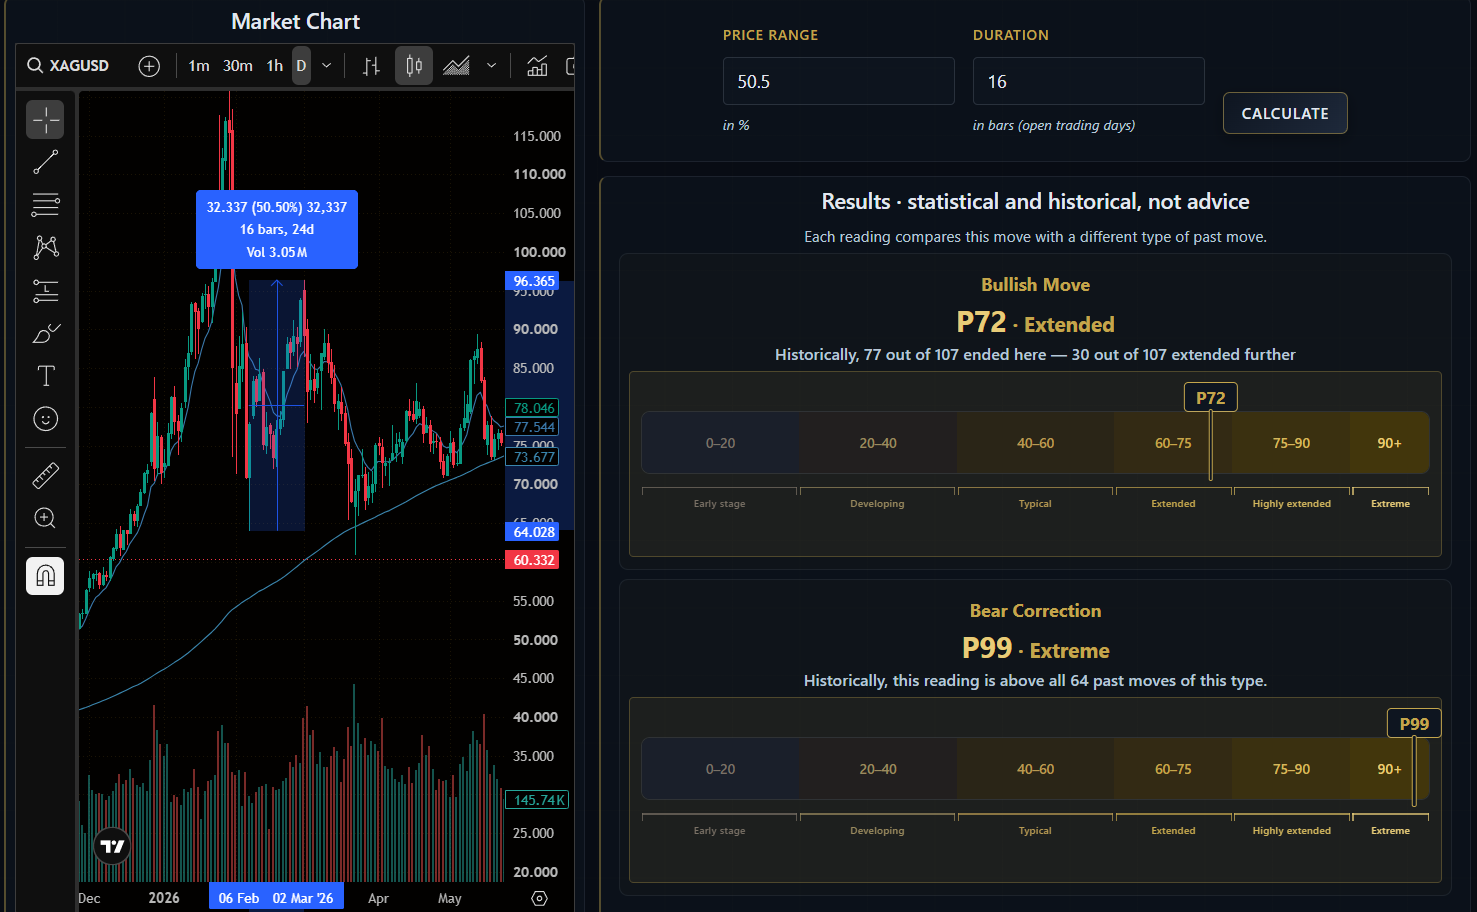
Silver's rebound after the January 2026 high, measured against its history
After the January 2026 high, silver rebounded 50.5% over 16 bars (open trading days). Investiming returned P99 for a bear correction — placing it in the Extreme zone.
How it works
In auto mode, Investiming detects the current swing automatically.
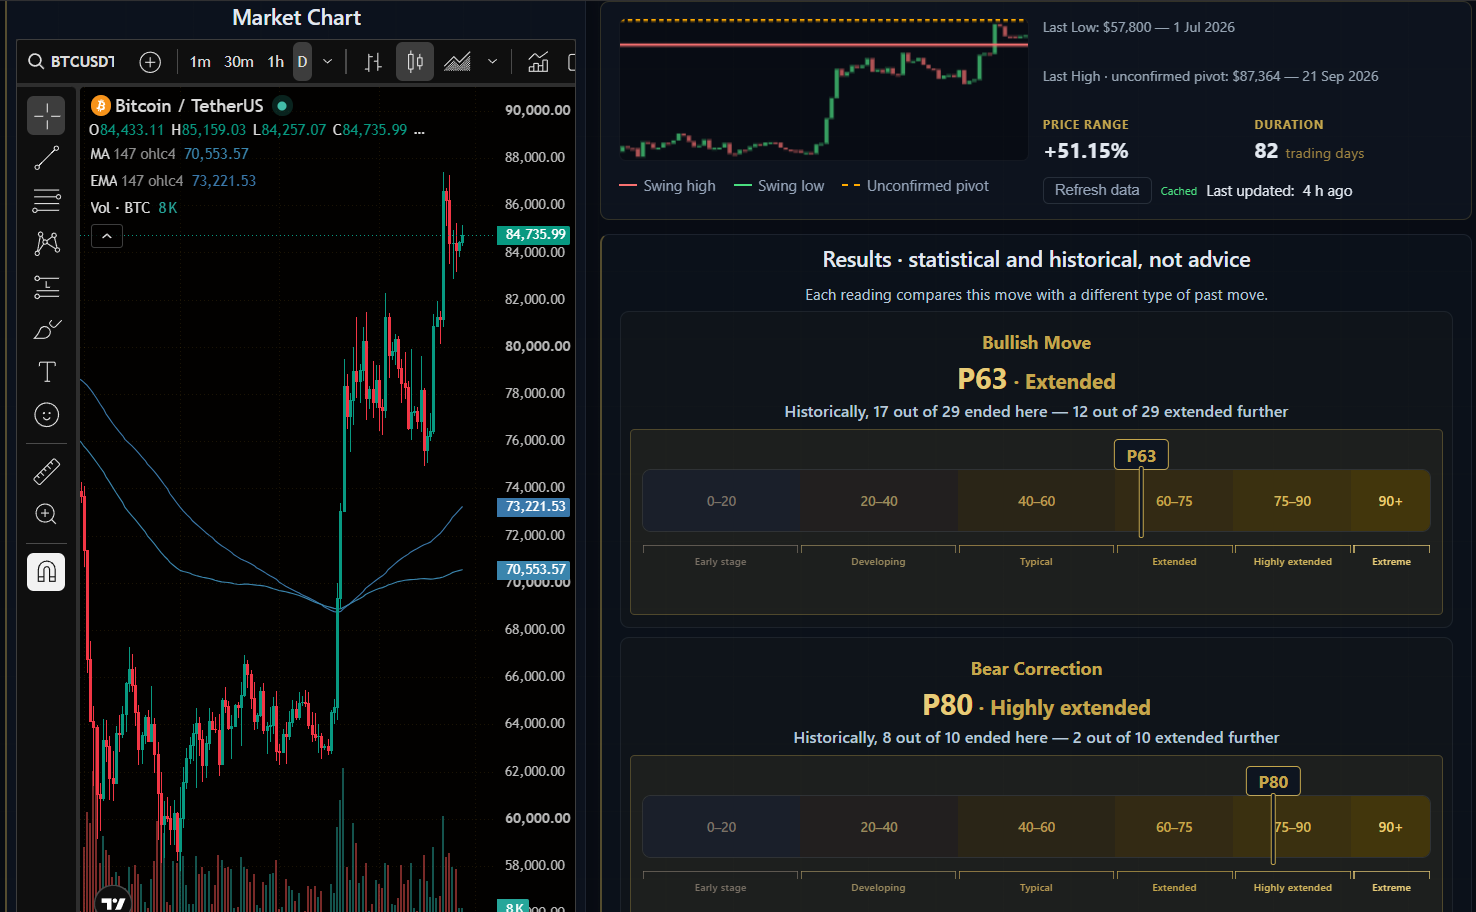
Auto mode measures from the last confirmed swing high or low to the last unconfirmed pivot — and reports the percentile automatically.
In manual mode, measure any move on the chart and enter the values yourself.
1 — Identify the start and end of the move on the chart
2 — Enter the price change and duration
3 — Get your percentile instantly
Available plans
Founding member
Founding member rate · locked in for life
- Full access — Currently: Bitcoin, Ethereum, Gold, Silver, S&P 500, Nasdaq, Tesla & Nvidia
- More assets to come
- Founding member price locked in for life
- Request new assets to be added
Open access during pre-release. Pricing applies at launch. Founding members lock in their rate permanently.
One subscription covers all 8 assets.
Risk disclaimer: The percentiles generated by Investiming are statistical calculations based on historical price data and do not constitute financial advice. Past price patterns do not guarantee future results. Movements may end earlier or extend beyond historical averages. Always apply your own judgement before making any investment or trading decision.


